Spotlight What Matters Most in Your Customer Conversations
Spotlight Summaries are here to shine a light on key trends in your conversations. This new feature analyses multiple interactions
Track every metric Keeping on top of the metrics and activities required to ensure your contact centre is running smoothly can be difficult and overwhelming. Every unnoticed issue directly impacts customer experience, leading to frustration, missed SLAs, and reduced customer satisfaction. At EdgeTier, we believe that machine learning, and in particular “anomaly detection” techniques, can…


Keeping on top of the metrics and activities required to ensure your contact centre is running smoothly can be difficult and overwhelming. Every unnoticed issue directly impacts customer experience, leading to frustration, missed SLAs, and reduced customer satisfaction.
At EdgeTier, we believe that machine learning, and in particular “anomaly detection” techniques, can play a valuable role in monitoring contact centre metrics and alerting management when unusual activity is detected. This is key as part of any agent assist process.
In this blog post we discuss anomaly detection, what it is, and how it can be used to improve customer experience within a contact centre.
Anomaly detection is a branch of statistics and computer science which focuses on the detection of rare, unusual, or new events which may occur within a system.
The presence of an anomaly can often point to a fault or potential future problem within the system. Some common examples of this include:
The main technical challenge posed by anomaly detection is that in most real world applications, there is no labelled data which identifies all the different anomalies which can occur within a particular system.
Without labels, we must rely on unsupervised learning techniques whose performance and accuracy are more difficult to assess, and we must be careful when training unsupervised models to ensure that we exclude as much anomalous data from our training set as possible. Excluding anomalous data prevents the model from learning that any previous anomalies that occurred are “normal” events.
While there are many anomaly detection algorithms, in this section I will discuss a few common approaches.
The one-class SVM is an unsupervised model, trained exclusively on “normal” data. The model will create a boundary line (or plane) around the training data and flag any new data points which lie outside of the boundary as anomalies. The SVM approach is easy to understand, and works well on high dimensional data (data with a lot of variables); however, it can struggle with understanding trends over time.

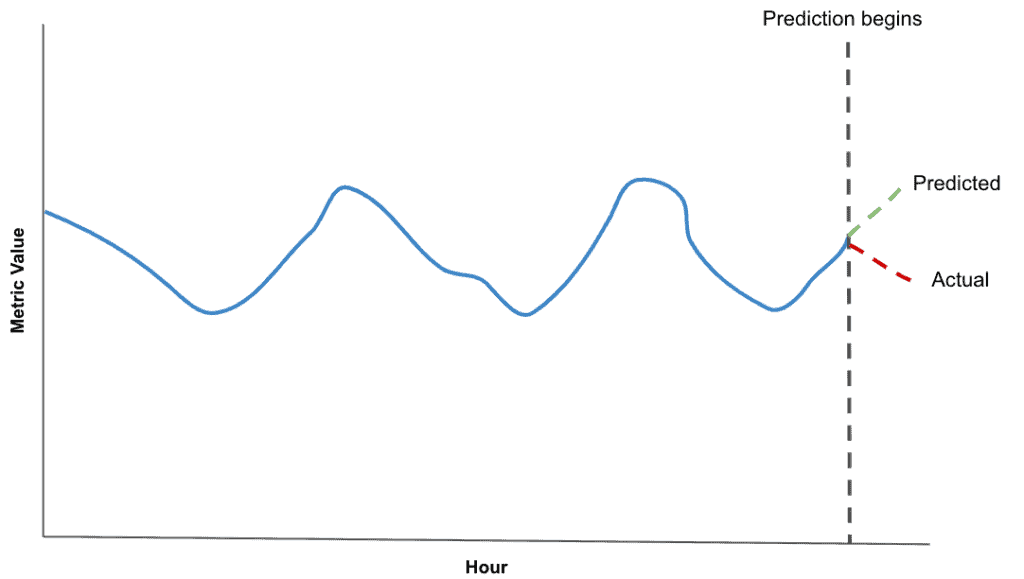
Regression is a statistical technique which attempts to understand and model the relationship between a set of predictors and some dependent variable (e.g. height and weight). We can leverage this in anomaly detection for time series data by attempting to predict the value of a particular variable (e.g. number of incoming chats) at any given time by using its values over the preceding 24 hours as a set of predictors. From here we can compare the actual value to the predicted and flag an anomaly if the difference is statistically significant.
While a regression approach works well with time series data, most simple regression algorithms will struggle with predicting anomalies among multiple related variables (e.g. number of incoming chats and number of incoming calls).
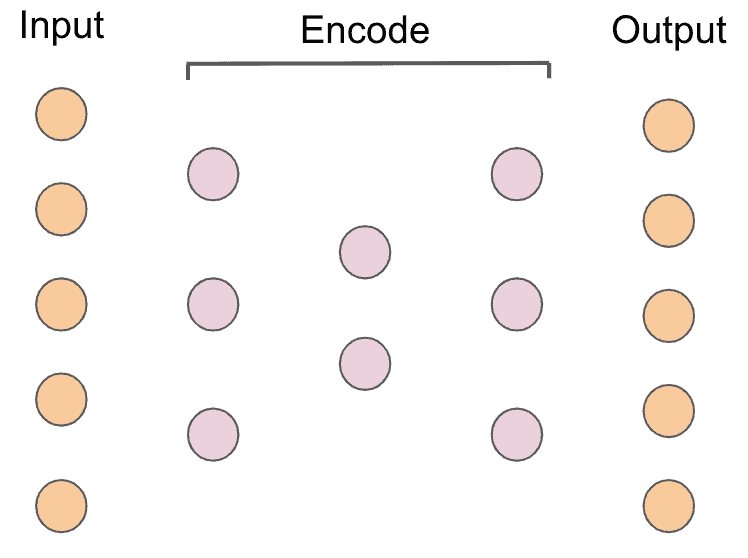
Autoencoders are a form of deep neural networks which can be used to detect anomalies across variables in a dataset. Although they were first described in 1987, recently advances in computing power and deep learning techniques have meant that autoencoders have become increasingly popular over the last decade.
When trained on normal data, an autoencoder will read in a set of values (e.g. incoming chats, calls, emails, etc.), compress them into an encoded format before decoding them back to their original input. The idea is that, since the model is only trained on normal data, it will struggle with decompressing anomalous data. We can compare the input values to the output, and flag an anomaly in any variable where the difference is statistically significant.
The autoencoder approach can work well when you want to detect anomalies within a number of related variables. However, like many deep-learning models typically a lot of training data is required to properly train an autoencoder, and, as with the SVM, it can struggle with time series data.
In this section, I will work through a simple example of how we might implement a one-class SVM in python to detect anomalies in two contact centre metrics (active agents and abandoned chats).
As with any data science task, we will begin by looking at our data. In the code snippet below you will see that I begin by creating a small training dataset before converting it into a pandas dataframe and looking at the first few rows of the data

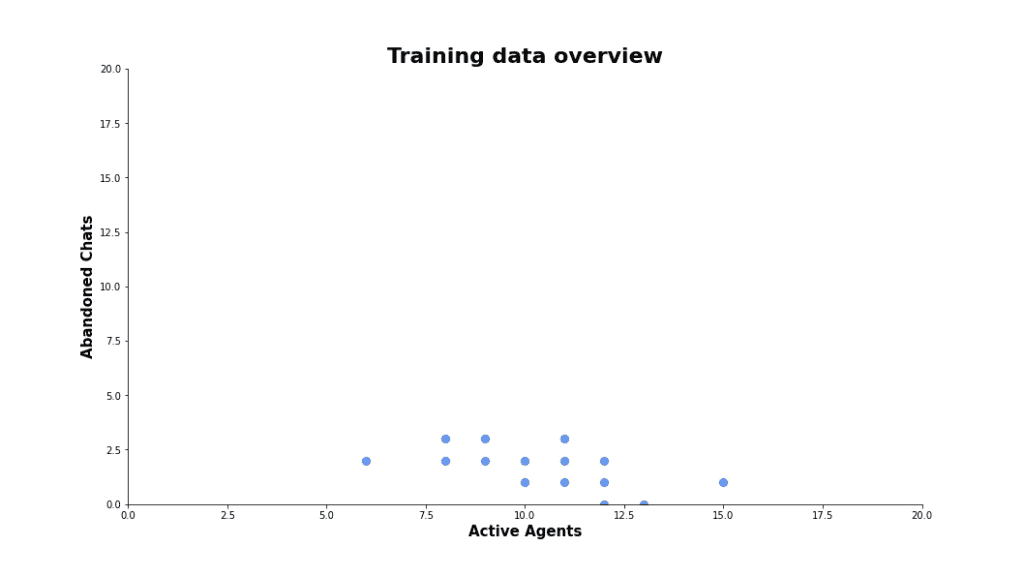
If we are happy that there are no anomalies in our training dataset, we can proceed to fit a model using this data.
To do this we will use scikit-learns OneClassSVM function. As demonstrated below, we create an SVM model object before passing in our training data using the .fit() method. This will generate an anomaly boundary around our training data.

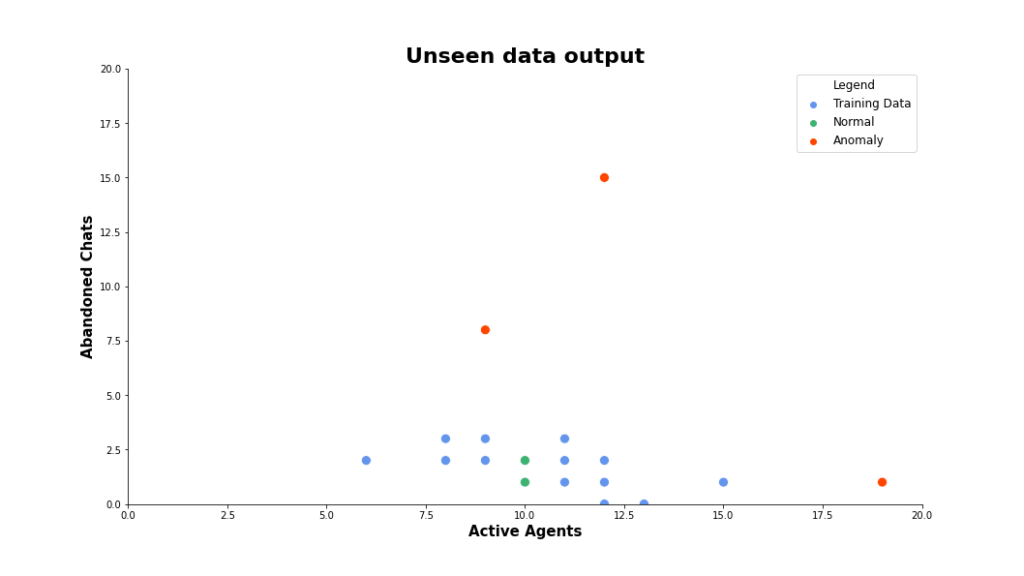
Once the model is trained, we are ready to start detecting anomalies. We do this by gathering a set of unseen data points and generating predictions from the model using the .predict() method. This will output an array of values in which anomalies are signified by a -1 and normal values by 1.
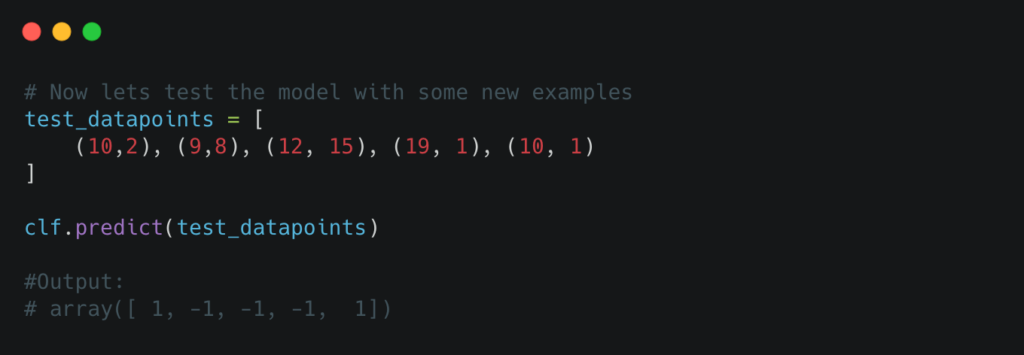
When we take a look at the output, we can see that the model identified three anomalies in the unseen data. Taking a look at these anomalies by plotting them alongside the training data, we can quickly see that two types of anomalies emerge:
Of course, this is a very simple example but I hope it gives you a better understanding of how you might go about implementing an anomaly detection system to assist agents and customer service teams, and the kind of outputs to expect.
At EdgeTier, our approach in the WatchTower product uses a multivariate deep-learning regression network to analyse trends and correlations among every contact centre metric over historical time periods and uses this information to predict the expected activity within the contact centre at any given moment.
From here, we perform a statistical comparison between the predicted and actual activity to determine if the contact centre is in an anomalous state, and if so, which metrics are driving the anomaly (e.g. a spike in incoming chats).
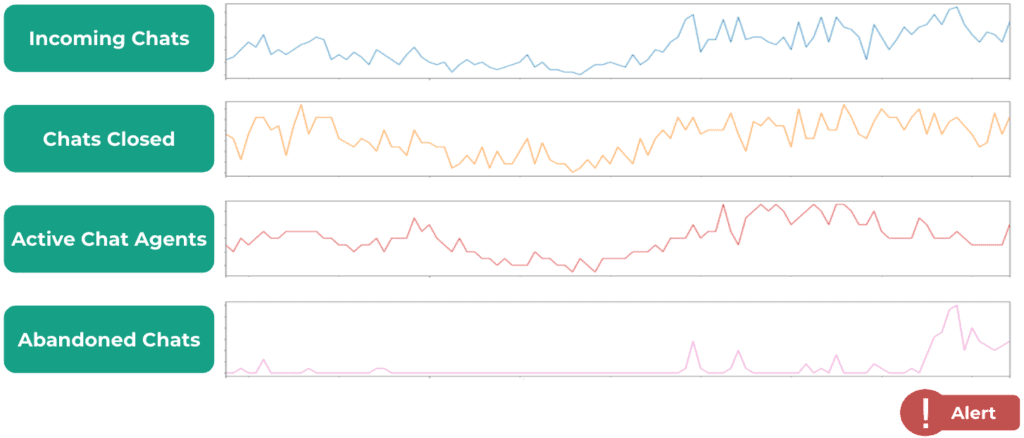
The advantage of the WatchTower approach is that it is capable of understanding both how each contact centre metric evolves over time, and how they relate to each other. For example, WatchTower will understand that a decrease in the number of incoming chats will typically result in a corresponding decrease in the number of chats resolved and number of chats abandoned over time.
Anomaly detection is an exciting branch of computer science with many real-world applications. We have seen above that we can very quickly spin up a simple anomaly detection system for two contact centre metrics. However, recent advances in deep learning have led to the development of more sophisticated anomaly detection models capable of identifying anomalies within large groups of related variables over time.
If you are interested in adding a layer of anomaly detection to your contact centre to bolster your agent assist process or would like to learn more about our approach to contact centre anomaly detection and how it can help you, get in touch, and be sure to read about our WatchTower product for anomaly detection in contact centre data.
Spotlight Summaries are here to shine a light on key trends in your conversations. This new feature analyses multiple interactions
We’ve just added confusion detection to our emotion analysis tools. Now, you can easily spot when customers are confused, allowing
Discover how EdgeTier’s latest AI-powered updates can optimise your contact centre, including anomaly detection summaries, agent QA, and custom charts.
"EdgeTier is no ordinary software product... It has completely changed how we work at CarTrawler."
"The average response time for post-booking type emails is about five hours. Previously, it was over 24 hours."
"It has reduced the time for the quality assurance process as it provides clear data and a very robust direction on where to look and what matters the most."


Let us help your company go from reactive to proactive customer support.
Unlock AI Insights