🚀 Introducing the EdgeTier Push API – Now Available!
We’re excited to announce that the EdgeTier API is now available for customers who want to send interaction data directly
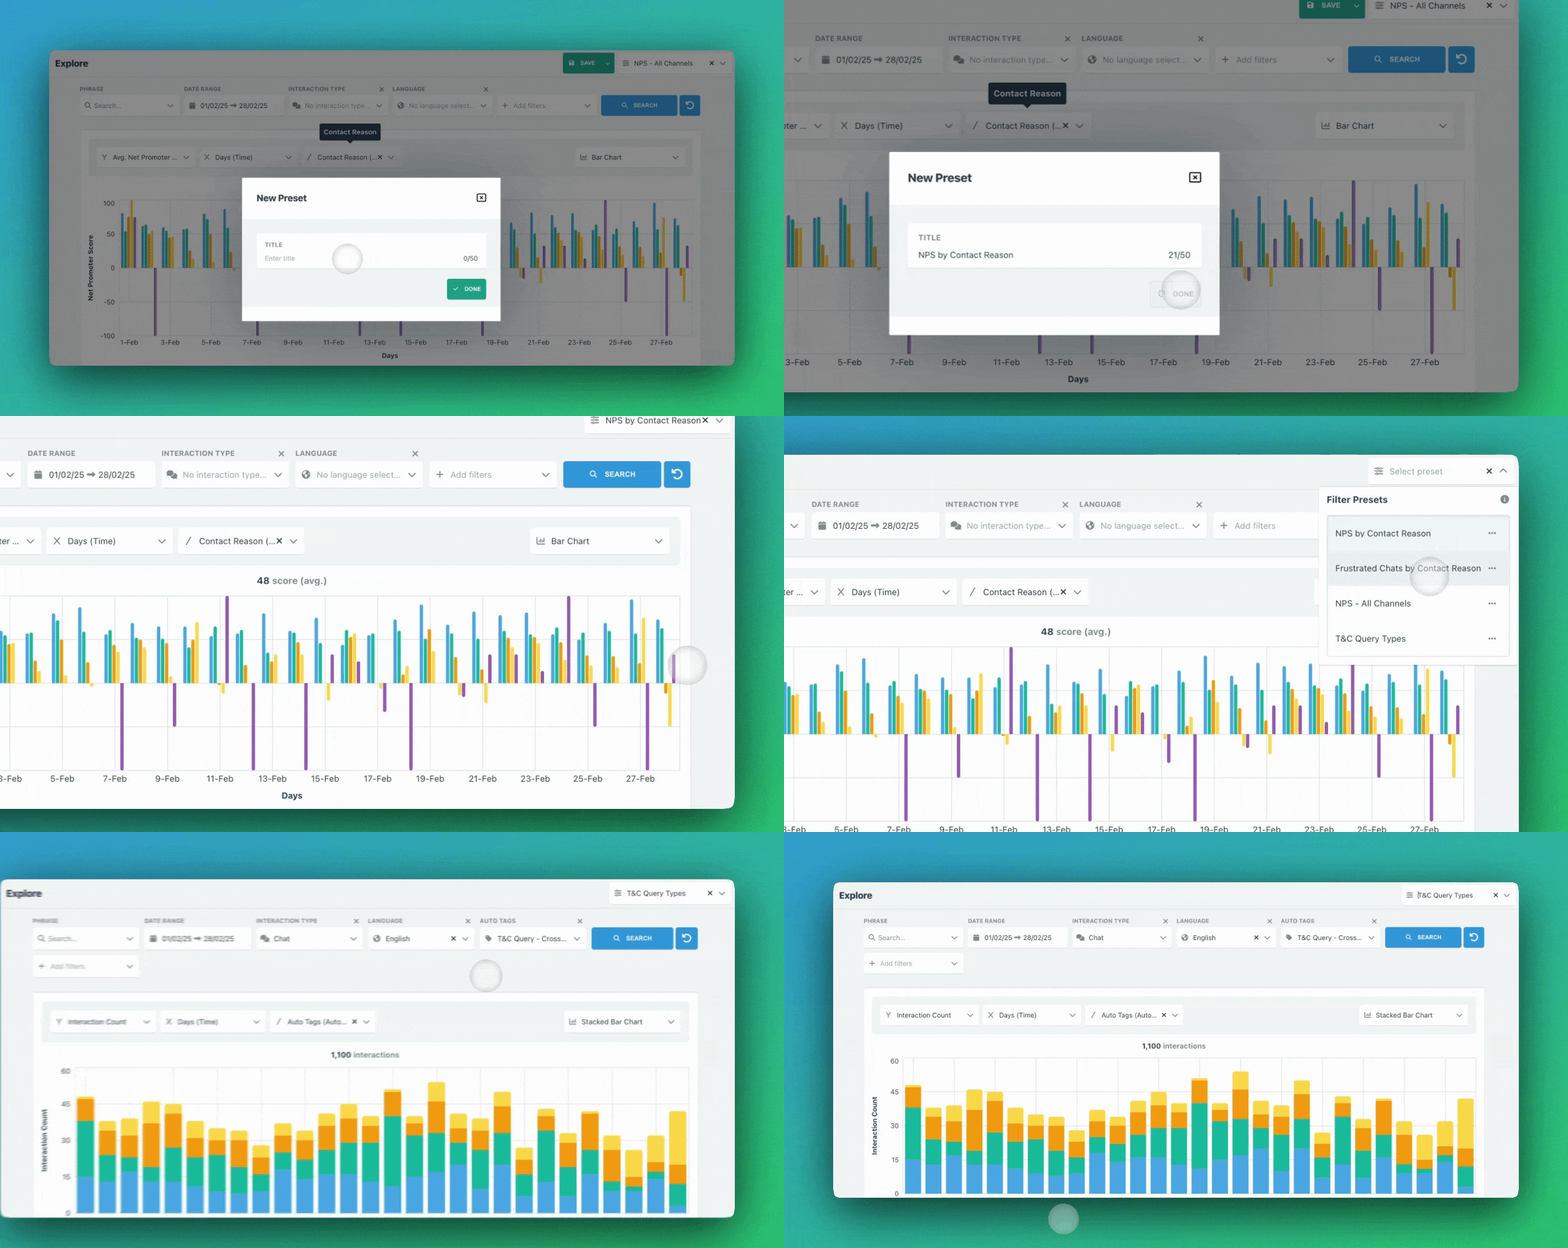
We’ve made it easier than ever to save and apply your favorite filter and chart settings on the Explore screen! Instead of manually re-entering filters and adjusting charts each time, you can now save your preferred setup as a "Preset"—allowing you to quickly switch between different data perspectives and track trends without extra effort.

This preset helps track interactions lasting over 30 minutes, broken down by region on a weekly basis.
4. Break Down by Region – Add a breakdown by Region so the data is segmented accordingly.
5. View the Chart – You will now see a chart displaying interactions that lasted more than 30 minutes, categorised by region over a weekly basis.
This preset helps analyse where customer frustration is highest—calls, emails, or chats, over a weekly period.
Track how different teams are performing on NPS without rebuilding reports. Save a preset like “NPS by Team” to instantly spot trends, identify issues, and coach teams accordingly.
Monitor brand performance by creating a “Weekly Interactions by Brand” preset. This helps detect customer contact trends and identify what’s driving spikes.
Interactions per Brand for a Specific Team
For teams handling multiple brands, create a “Brand Interactions – [Team Name]” preset to compare how each team is managing conversations.
With Presets, you can spend less time setting up filters and more time acting on insights. This feature is available to all WatchTower users.
We’re excited to announce that the EdgeTier API is now available for customers who want to send interaction data directly
Spotlight Summaries is here! This new feature makes it easier to spot trends in customer conversations. Instead of reviewing interactions
You can now apply filters to Tag Groups on the Configuration > Tags and Triggers screen. In short, tag group
"It has reduced the time for the quality assurance process as it provides clear data and a very robust direction on where to look and what matters the most."
"I specifically liked the flexibility. I liked the can-do attitude. I always felt supported. There hasn’t been any single point in our journey where EdgeTier has said no."
"EdgeTier is really shining when it comes to responsible gambling. We can proactively track critical issues and take actions, reducing human error."


Let us help your company go from reactive to proactive customer support.
Unlock AI Insights